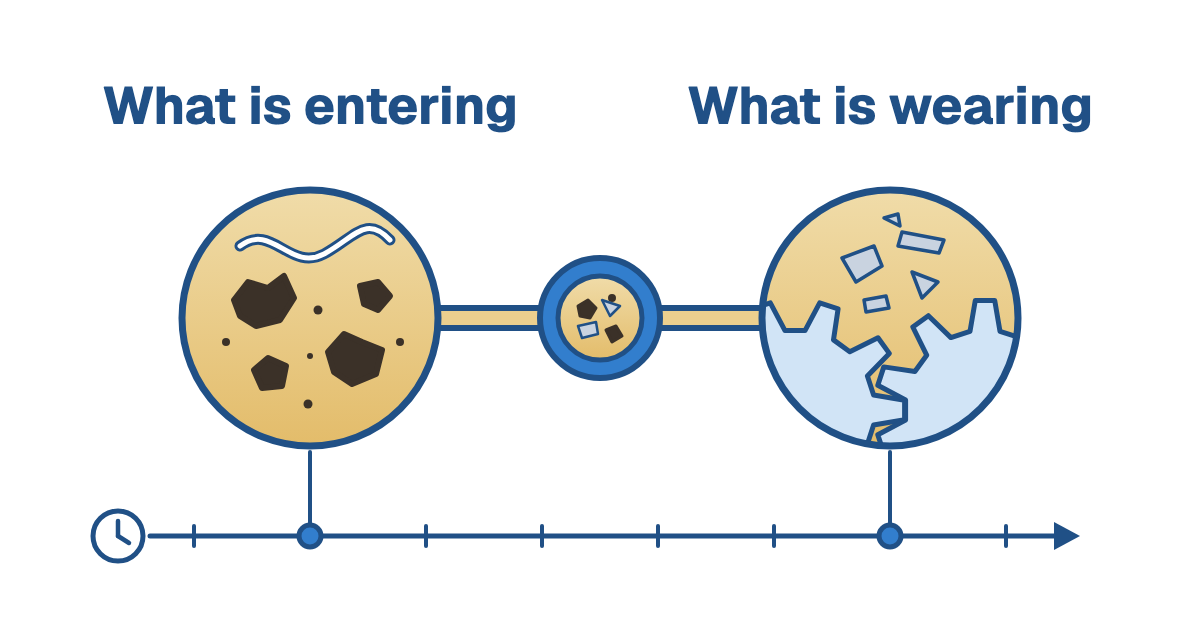
The particle count is rising again. A filter change brings a brief improvement, then the next report is worse. Before ordering another element or condemning a bearing, establish whether material is entering the oil, being generated inside the machine, or both.
A particle count describes how much material the method detects in specified size bands. It does not identify the source of that material. To distinguish contamination from wear, combine a comparable count with examination of the particles, the sampling location and the machine's operating history. The useful decision is whether to correct an entry route, restore filtration, investigate a component, or pursue those actions together.
A cleanliness code cannot identify the damaged component
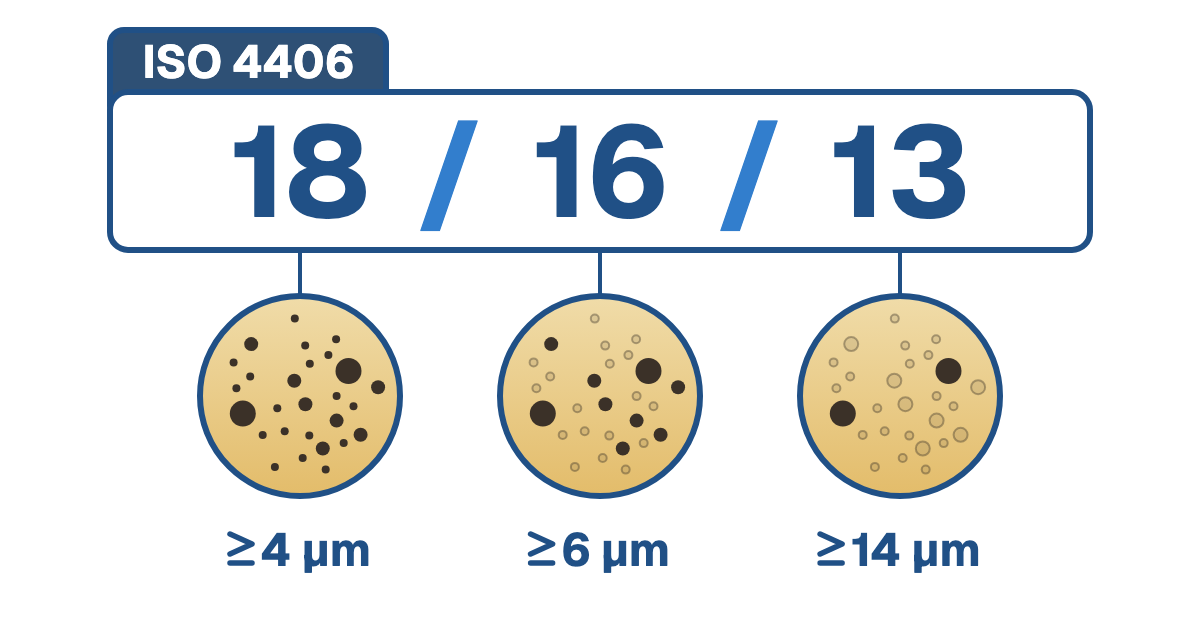
An ISO 4406 cleanliness code is useful for tracking particle levels against the equipment's requirement. Two samples can have similar codes while containing different material. The code alone does not tell you whether the particles are mineral dirt, fibres or metal, or how that metal left a component.
That matters commercially. Replacing filters can remove circulating material while leaving the source active. Replacing a bearing on the strength of a count alone can send the maintenance team toward the wrong job. A lower count after treatment establishes a change in the measured contamination. Evidence of sustained machine health requires a wider view.
The Spectro Scientific oil-analysis handbook separates particle count, elemental concentration and particle shape into different measurements. Each contributes something useful. Ask what the report actually measured before using its conclusion to decide on maintenance.
Swipe across the table to read all columns.
| Evidence | What it contributes | What still needs investigation |
|---|---|---|
| Particle count and size distribution | The amount of detected material and the size bands that are changing. | Particle identity, source and the reason for the change. |
| Elemental analysis | The concentration of elements detected by the method, including relevant wear metals. | The size range covered and the component responsible. It is not a substitute for examining larger debris. |
| Particle examination | Images and classification of captured particles, including shape and, with suitable methods, material characteristics. | Whether the suggested wear mechanism fits the machine and its operating evidence. |
| Temperature, vibration and inspection | Evidence of what the machine is doing and which components need attention. | How those findings relate to the oil trend, maintenance events and particle source. |
Confirm that the rise is real and comparable
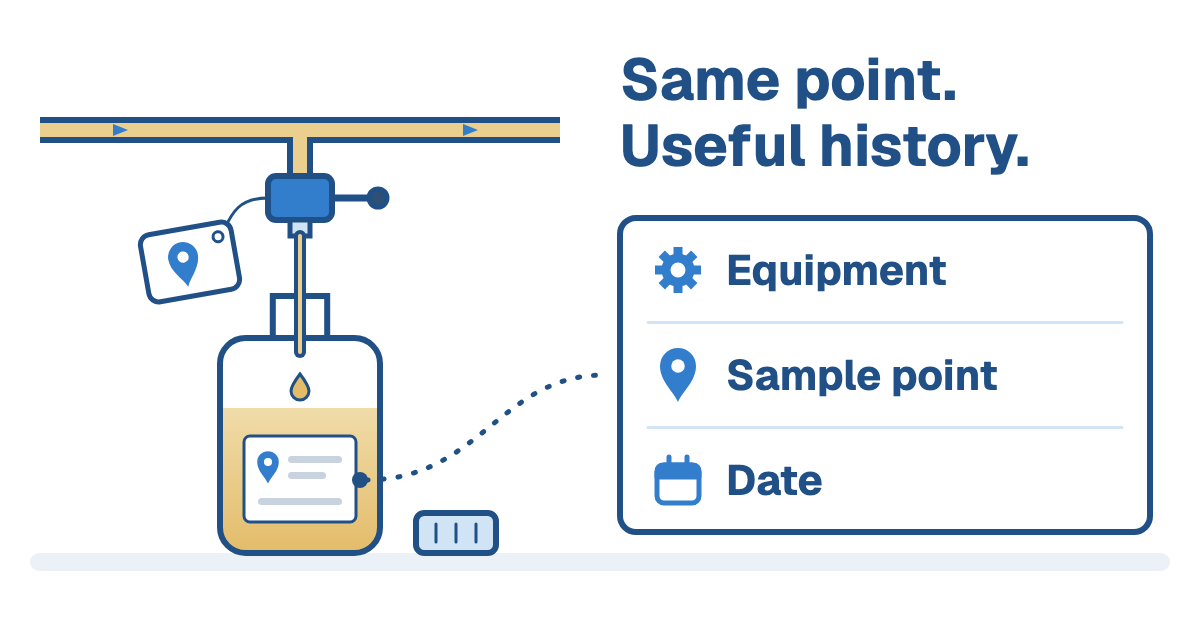
Start with the sample record. Use the same identified sampling point and method, and record operating condition, oil hours and recent maintenance. Oil added between samples, a changed filter or a different sampling location can alter the comparison. A result taken after filtration answers a different question from one taken in the oil returning from the machine.
A repeat sample can check an unexpected laboratory result when the site's operating condition permits. It should use the agreed oil-sampling procedure, rather than another convenient drain point. Where machine alarms or other evidence already require action, a request for confirmation must fit the site's existing response procedure.
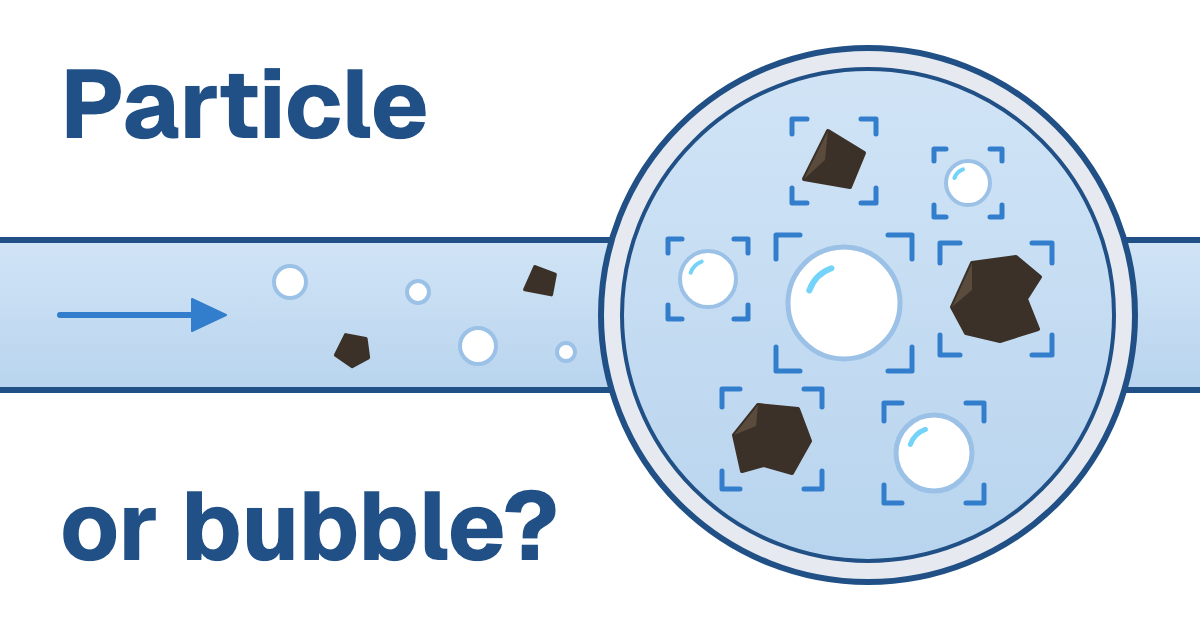
Also check whether the method is suitable for the sample. Air bubbles complicated particle measurements in documented Atten2 applications. That does not make every high reading an air problem. Our guide to bubbles and oil particle counts explains the measurement question. Establish whether the reported rise represents solid material before assigning it a mechanical cause.
Examine what is increasing, not only how much
Morphology means particle shape. Microscopic examination and suitable image-based instruments add information that a count cannot provide. Atten2 describes how OilWear uses digital images to measure particle size and shape. An analyst may identify nonmetallic material or classify wear-shaped particles into categories such as cutting, fatigue and sliding wear. Those observations narrow the investigation when they are read with size, quantity and change over time.
A shape classification is evidence about a possible wear mechanism. It is not a chemical analysis or a label identifying a particular bearing. Ask for representative images, the method used and the size range that was examined. Where material identification matters, agree what additional analysis is needed rather than inferring alloy or component identity from an image alone.
Use the finding to choose a specific next check. Mineral or fibrous contamination directs attention toward handling, filling and possible entry routes. An increasing population of wear-shaped metal particles gives the mechanical team a reason to review the affected lubrication circuit and corroborating machine data. Neither route excludes the other. Incoming contamination and internal wear can develop in the same system.
Swipe across the table to read all columns.
| Finding to investigate | Useful next question | Evidence to retain |
|---|---|---|
| A sudden increase after filling or maintenance | What changed in the oil handling, sampling or system access? | Work records, oil additions, sample location and retained particle images. |
| A growing population of larger wear-shaped particles | Does the change match machine symptoms or an emerging wear mechanism? | Size and shape trends alongside load, temperature, vibration and inspection findings. |
| Higher contamination during a filter event | What reached the machine when filtration changed or entered bypass? | Filter history and clearly identified measurements before and after the filters. |
| Counts fall after cleanup, then rise again | Is material continuing to enter or form inside the system? | Comparable follow-up samples and checks of the suspected source. |
A ball mill showed contamination followed by wear
At an anonymous minerals-processing facility in Queensland, persistent contamination affected a ball mill's lubrication system. The existing monitoring had difficulty providing timely information in the slow-speed application, which used viscous, aerated oil. GVS, Atten2's Australian partner, installed two OilWear S sensors. One measured oil upstream of the filters; the other checked the oil entering the gearbox downstream.
Atten2's May 2026 case study describes a filter-brand trial in which elements blocked and the system entered bypass. Particle levels rose. Later, larger particles and classifications associated with fatigue and sliding wear increased. The sequence helped the team distinguish the initial contamination events from the subsequent evidence of machine wear.
The plant still needed substantial maintenance. Despite ten filter changes, contamination persisted until shutdown. The team replaced 6,000 litres of oil and scheduled the gearbox for refurbishment. Monitoring helped them track the event and choose the maintenance timing; it did not repair the underlying problem or eliminate the need for a shutdown.
The case, documented by Atten2, a NATCOM technology partner, shows why the particle population and its timing matter. A single cleanliness result would not have described the whole progression. Its particular wear classifications and operating constraints belong to that gearbox; another machine needs its own evidence.
Choose the response around the source of the debris
If the evidence points toward external contamination, investigate how it reaches the circuit and whether the existing filtration controls it. Include the handling arrangements and the condition of relevant access points, seals and breathers in the review. Cleaning the oil addresses material already present. The source needs attention if the improvement is to hold.
If the evidence points toward increasing wear, involve the mechanical team while the oil investigation continues. Appropriate particle removal can still protect the system, but it does not restore a damaged surface. The operating decision should use the site's equipment limits, machine symptoms and qualified assessment, rather than a generic particle threshold copied from another asset.
When both appear, retain both lines of investigation. Document what action is intended to reduce contamination and what action will assess or correct the machine. NATCOM's industrial oil-analysis service can help define the test scope and connect the findings to that maintenance decision.

Frequently asked questions
It can indicate contamination, wear debris or a mixture. The count alone does not identify the material or its source. Check sample comparability, particle size and examination results alongside operating and maintenance evidence.
Morphology means particle shape. Microscopic or suitable image-based examination can help classify material and investigate wear mechanisms such as cutting, fatigue and sliding. Shape classification does not by itself establish material chemistry or identify the exact failed component.
No single result covers every type and size of debris. Elemental methods and particle-examination methods have different capabilities. Ask which size range the laboratory method covers and whether larger-debris examination is needed for the machine and concern.
Oil returning from the machine and oil downstream of a filter can contain different particle populations. Identify the point and keep it consistent for trend comparisons. When comparing several points, label each clearly and interpret it according to its place in the circuit.
It demonstrates an improvement in the measured particle condition under the sampling conditions. It does not show that an entry route has been corrected or a damaged component repaired. Follow the contamination and wear trends together with appropriate machine evidence.